General remarks for the statistics on primary schools are given below.Top of Page
- ) The number of primary schools decreases by 29 between 1990 to 1991.
- ) The number of pupils increases in private schools but these decrease in total.
- ) The number of pupils in a class is 29 on average.
- ) The number of teachers increases while that of pupils decreases.
- ) The elementary school teachers are required to graduate from colleges(2 years) or universities(4 years). Teachers who graduate from 2-year colleges have studied science much less than those of 4-year university graduates. This fact would be a potential source of difficulty as far as science education is concerned because the percentage of teachers who are 2- year college graduates will increase in the next few years.
- ) Large elementary schools can employ specialist teachers who teach only their specialty, e.g., gymnastics,, art, music, home management or science(rika ).
Table A.1.1 Number of SchoolsYear Total National Public Private --------------------------------------------------- 1989 24,851 73 24,608 170 1990 24,827 73 24,586 168 1991 24,798 73 24,557 168 --------------------------------------------------- Table A.1.2 Number of Classes --------------------------------------------------- Year Total National Public Private ----------------------------------------------------- 1989 317,259 1,279 314,185 1,795 1990 315,426 1,279 312,338 1,809 1991 313,707 1,280 310,602 1,825 ----------------------------------------------------- Table A.1.3 Number of Students ----------------------------------------------------- Year Total National Public Private --------------------------------------------------------- 1989 9,606,627 47,400 9,496,553 62,674 1990 9,373,295 47,304 9,262,201 63,790 1991 9,157,429 47,234 9,045,154 65,041 Per Class 29.2 36.9 29.1 35.6 Per Teacher 20.6 26.5 20.5 22.2 --------------------------------------------------------- Table A.1.4 Number of Teachers --------------------------------------------------------- Year Total National Public Private Women/% ---------------------------------------------------------------- 1989 445,450 1,782 440,777 2,891 57.5 1990 444,218 1,783 439,542 2,893 58.3 1991 444,903 1,781 440,188 2,934 59.3 ---------------------------------------------------------------- ----------------------------------------------------------------
General remarks for the statistics on lower secondary schools are given below.Top of Page
- ) The number of schools as well as the class size increases.
- ) The number of students increase in private schools but the total number of private schools decreases.
- ) The number of teachers increases.
- ) The number of science teachers is adjusted according to the number of science classes of the school.
- ) About 95% of students go to upper secondary schools and 2.5 % of students find employment.
- ) Every lower secondary school has a laboratory for science experiments.
Table A.2.1 Number of lower secondary schoolsYear Total National Public Private --------------------------------------------------- 1989 11,264 78 10,578 608 1990 11,275 78 10,588 609 1991 11,290 78 10,595 617 --------------------------------------------------- Table A.2.2 Number of Classes --------------------------------------------------- Year Total National Public Private ---------------------------------------------------- 1989 154,054 885 148,426 4,743 1990 152,466 886 146,535 5,045 1991 152,009 886 145,923 5,200 ---------------------------------------------------- Table A.2.3 Number of Students ---------------------------------------------------- Year Total National Public Private ------------------------------------------------------- 1989 5,619,297 36,502 5,386,134 196,661 1990 5,369,162 35,851 5,130,708 202,603 1991 5,188,314 35,170 4,942,223 210,921 Per Class 34.1 39.7 33.9 40.6 Per Teacher 18.1 20.9 17.9 21.4 ------------------------------------------------------- Table A.2.4 Number of Teachers ------------------------------------------------------- Year Total National Public Private Women/% --------------------------------------------------------------- 1989 286,301 1,679 275,415 9,207 35.7 1990 286,065 1,683 275,012 9,370 36.4 1991 286,965 1,685 275,406 9,874 37.3 --------------------------------------------------------------- Table A.2.5 Number of graduates (lower secondary school) --------------------------------------------------------------- Year Total Upper secondary School Work --------------------------------------------------------------- 1989 2,049,471 1,941,320 (94.7%) 59,461 (2.9%) 1990 1,981,503 1,884,183 (95.1%) 54,822 (2.8%) 1991 1,860,300 1,774,056 (95.4%) 48,001 (2.6%) --------------------------------------------------------------- ---------------------------------------------------------------
General remarks for the statistics on upper secondary schools are given below.Top of Page
- ) The number of upper secondary schools decreases.
- ) The number of students decreases but the number of teachers remains nearly constant.
- ) About 30% of students go to colleges or universities and about 35% of them find employment.
- ) The number of chemistry teachers is adjusted according to the number of chemistry classes of each school.
- ) Each upper secondary school has a laboratory for chemical experiments.
- ) About 44% of equipment required by the Government (Risin-ho) was purchased on average.
(by Research of Nippon Rikagaku Kyokai 1991)
Table A.3.1 Number of Upper secondary SchoolsYear Total National Public Private Private School/% ---------------------------------------------------------------------- 1989 5,511 17 4,183 1,311 23.8 1990 5,506 17 4,177 1,312 23.8 1991 5,503 17 4,170 1,316 23.9 ---------------------------------------------------------------------- Table A.3.2 Number of Students (Upper secondary School) ---------------------------------------------------------------------- Year Total National Public Private Private School/% ---------------------------------------------------------------------------- 1989 5,644,376 10,362 4,030,091 1,603,923 28.4 1990 5,623,336 10,338 4,001,232 1,611,766 28.7 1991 5,454,929 10,349 3,869,148 1,575,432 28.9 ---------------------------------------------------------------------------- Table A.3.3 Number of Teachers ---------------------------------------------------------------------------- Year Total National Public Private Private School/% ----------------------------------------------------------------------- 1989 284,461 628 219,407 64,426 20.1 1990 286,006 627 220,322 65,057 20.5 1991 286,092 628 220,049 65,415 20.9 ----------------------------------------------------------------------- Table A.3.4 Number of graduates ----------------------------------------------------------------------- Year Total Colledge or University Work ---------------------------------------------------------------- 1989 1,700,789 520,569 (30.7%) 606,150 (35.6%) 1990 1,766,917 538,890 (30.6%) 622,330 (35.2%) 1991 1,803,221 570,090 (31.7%) 620,614 (34.4%) ---------------------------------------------------------------- ----------------------------------------------------------------
See also, Table 3.6.1 The Number of Chemistry Major Freshmen in the Total Distribution of Majors who entered Universities in Japan in 1992Top of Page
Table A.4.1 Approximate Numbers of Students of Chemistry or Chemistry-related SubjectCourse Bachelor Master Doctor ---------------------------------------------------------------------------------------- Dept. Chem., Fac. Science 10,000 3,000 1,500 Dept. Appl. Chem. (or related Dept.), Fac. Engineering 50,000 8,000 2,500 Total (including Agric. Chem., Pharm. Chem. etc.) 100,000 12,000 5,000 ---------------------------------------------------------------------------------------- Table A.4.2 Number of Workers in Chemical Industry (103) ---------------------------------------------------------------------------------------- Year 1980 1985 1988 1992 ----------------------------------------------------------- Chemical Industry 410 395 390 415 Total Manufacturing 10,209 10,647 10,696 11,159 ----------------------------------------------------------- Table A.4.3 Composition of Workers in Chemical Industry (%) ----------------------------------------------------------- ------------------ Male 85.8 Bachelor or above 15.9 Female 14.2 Junior College Graduates 6.0 ------------------------------------------ High School Graduates 41.2 Lower Secondary 15.2 ------------------ Table A.4.4 Number of Personal Attendants in Chemistry-Related Academic Societies in 1994 ------------------------------------------ General Student Others ----------------------------------------------------------------------- The Chemical Society of Japan 29,962 3,495 2,444 The Society of Chemical Engineers, Japan 7,992 1,274 71 Japan Society for Bioscience, Biotechnology, and Agrochemistry 12,123 2,049 180 The Pharmaceutical Society of Japan 19,049 2,115 370 ----------------------------------------------------------------------- -----------------------------------------------------------------------
Top of PageTable A.5.1 Shipment Value of Chemical and other Manufacturing Industries (109 Yen)Year 1978 1980 1985 1990 1992 ---------------------------------------------------------------------------- Chemical 12,853 17,961 20,552 23,390 24,152 Foodstuffs 19,395 22,196 20,542 22,748 24,758 Textile 6,948 7,781 8,087 7,838 7,574 Plastics - - 8,052 10,466 11,229 Iron and Steel 13,439 17,864 17,754 18,269 16,590 Metal Products 8,546 10,311 13,094 18,574 19,814 General Machinery 13,437 17,361 24,225 33,639 33,724 Electric Machinery 16,246 22,160 40,842 54,529 54,521 Transportion Machinery 20,243 24,897 36,179 46,858 49,608 Total 162,594 212,124 265,321 323,373 329,640 ---------------------------------------------------------------------------- Table A.5.2 Shipment Value of Various Products of Chemical Industry (109 Yen) ---------------------------------------------------------------------------- Year 1970 1975 1980 1985 1990 1992 ------------------------------------------------------------------------------- Chemical Fertilizers 206 558 504 443 324 337 Inorganics 512 922 1,343 1,500 1,384 1,551 Organics 1,958 3,992 7,976 8,316 8,788 8,575 Petrochemical Basics 151 643 1,956 1,281 1,095 764 Aliphatic Intermediates 250 707 1,104 1,136 1,064 1,025 Aromatics, Dyes & Pigments 372 902 1,648 1,515 1,622 1,522 Plastics 809 1,090 1,968 2,910 3,625 3,819 Synthetic Rubber 140 210 389 501 546 415 Other Organics 236 440 893 973 837 1,030 Fiber 780 766 1,146 1,080 1,044 1,059 Final Products 2,084 4,200 6,993 9,215 11,850 12,630 Oil & Fat, Detergents 279 381 626 774 967 1,043 Paint & Vanish 221 471 780 1,000 1,155 1,167 Pharmaceuticals 933 1,643 2,893 3,829 5,153 5,508 Agricaltural Chemicals 84 287 363 445 373 372 Cosmetics 261 594 847 1,061 1,376 1,481 Adhesives 33 77 172 189 233 247 Photosensitive Materials 117 249 480 747 962 1,137 Other Final Products 156 489 832 1,169 1,631 1,675 Total 5,540 10,438 17,961 20,552 23,390 24,152 ------------------------------------------------------------------------------- ------------------------------------------------------------------------------- Table A.5.3 Consumption of Raw Materials in Chemical Industry (103 t)Year 1983 1986 1988 1990 1992 ------------------------------------------------------------------------ Naphtha 13,563 15,206 18,131 19,576 20,719 Industrial Salt 5,851 6,153 6,879 7,491 7,268 Phosphate Rock 2,142 1,859 1,575 1,397 1,236 Raw Oil and Fat 941 997 1,039 1,068 1,025 Sulfur 681 752 798 775 771 ------------------------------------------------------------------------ ------------------------------------------------------------------------ Table A.5.4 Export and Import Values of Chemicals by Product ($106)Export Import --------------------------------------------------------------------------------- 1980 1985 1990 1992 Year 1980 1985 1990 1992 --------------------------------------------------------------------------------- 2,276 2,512 5,640 6,689 Organics 1,679 2,411 4,457 4,676 719 708 1,180 1,214 Inorganics 642 742 1,194 1,218 425 558 1,224 1,541 Dyes & Pigments 272 319 700 690 295 391 879 1,366 Pharmaceuticals 1,074 1,292 2,834 3,671 174 263 579 707 Oils & Cosmetics 231 252 725 853 377 127 109 109 Fertilizer 279 258 405 416 1,867 2,261 4,386 5,199 Plastics 563 744 1,660 1,672 636 878 1,875 2,294 Others 1,462 2,054 4,070 4,150 6767 7,698 15,872 19,118 Total 6,202 8,073 16,045 17,355 --------------------------------------------------------------------------------- --------------------------------------------------------------------------------- Table A.5.5 Export and Import Values of Chemicals by Block ($106)Export Import --------------------------------------------------------------------------------------- 1980 1985 1990 1992 Block 1980 1985 1990 1992 --------------------------------------------------------------------------------------- 3,024 3,161 7,849 9,417 Far East 574 665 1,771 1,778 257 169 283 283 Near-Mid East 28 153 602 395 881 1,125 3,183 3,883 West Europe 2,081 2,651 6,510 7,705 845 1,532 2,605 3,342 North America 2,730 3,667 5,500 5,735 272 219 282 382 Central & South America 194 347 584 632 158 114 138 138 Africa 67 70 69 52 302 286 384 420 Oceania 240 99 202 235 1,026 1,091 1,148 1,252 U. S. S. R., East Europe, 288 420 807 824 Asian Communist Block 6767 7,698 15,872 19,118 Total 6,202 8,073 16,045 17,355 --------------------------------------------------------------------------------------- --------------------------------------------------------------------------------------- Table A.5.6 Amount of Research and Development Spending (109 Yen) and its Value relative to Shipment value (%) by Field of Manufacturing IndustryR &D Spending R &D Spending / Shipment value -------------------------------------------------------------------------- -------------- Year 1990 1992 1980 1985 1990 1992 -------------------------------- Chemicals 1,417 1,605 2.55 3.79 4.89 5.39 Foodstuffs 218 230 0.58 0.77 0.98 0.93 Ceramics 215 214 1.30 2.61 2.60 2.69 Iron and Steel 304 312 1.14 1.94 2.33 2.58 Non-ferrous Metal 141 146 1.03 1.92 1.80 2.23 Machinery 650 652 1.90 2.74 2.99 3.10 Electric Mach. 3,146 3,221 3.71 5.10 5.86 6.17 Transport. Mach. 1,496 1,499 2.34 2.90 3.65 3.45 Precision Mach. 336 327 3.02 4.49 5.94 5.79 Total 8,660 8,971 Average 1.73 2.69 3.36 3.52 -------------------------------------------------------------------------- --------------------------------------------------------------------------
This section contains a few representative examples of problems on entrance examinations for lower secondary school to university. This will give the reader a rough idea of what is required in entrance examinations (so often quoted!) in Japanese schools.
A. rock salt, B. boric acid, C. copper powder, D. sodium hydroxide, and E. dry ice,15.0 g was thrown into 100.0g of water at 20°C and at 40°C. After stirring thoroughly, the solutions were filtered, while keeping the temperature constant. The weights of the liquids thus filtered were measured. The results are given in the table below. Answer the questions. You may assume that the filtration does not affect the amount of water. Answer should be given up to two decimal points.
Weight of the liquid/g 20°C 40°C --------------------------------------------------- A Sodium chloride 111.5 115.0 B Boric acid 105.7 108.7 C Copper powder 100.0 100.0 D Sodium hydroxide 115.0 115.0 E Dry ice 100.2 100.1 --------------------------------------------------- --------------------------------------------------- (1) There is a limit to the amount of material which can be dissolved in water. Judging from the results at 40°C, answer which of the solutions A to E contains the maximum possible amount of material dissolved. What is the amount which remains on the filter paper ? Follow the example below.
Example: F(5,7)
(2) Which of the solutions filtered are neutral ? Answer with letters A to E.
(3) What is the concentration of the filtered solution ? Answer in percent.
(4) By accident 10g of boric acid and 10g of copper powder were mixed. How much water is needed if the copper is to be recovered by dissolving this mixture in water and filtering the solution at 40°C ?
(5) The construction of the gas burner is as shown in Figure D.1. Suppose the flame is small and strong (i.e., blue flame). You want to get a large and strong (blue) flame. Select the correct actions and arrange them in the right order.
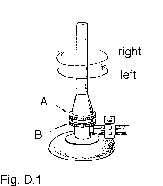
1) Turn the air adjustment screw A right.
2) Turn the air adjustment screw A left.
3) Turn the gas adjustment screw B right
4) Turn the gas adjustment screw B left.
Top of Page
(2) What liquid should be poured through A and what solid should be put in vessel B to generate oxygen and carbon dioxide, respectively ? Select the right materials from among those given below.
b. Limestone
c. Rock salt
d. Lime water
e. Steel wool
f. Dilute hydrochloric acid
g. Sodium hydroxide
h. Aqueous solution of hydrogen peroxide
Top of Page
(2) White precipitate is formed when the dilute sulfuric acid is added to that solution. What substance is precipitated ?
(3) Figure D.3 shows the magnitude of electric current flowing through the solution while sulfuric acid is being added. Select the correct words to fill in the blanks.
The solution is ( A ) at the moment when 55 cm3 of dilute sulfuric acid is added. This is because of the presence of ( B ) in the solution.
acidic, neutral, alkaline
Top of Page
(b) Copper oxide is added to A. A is heated while hydrogen is supplied from B.
(c) Copper oxide and carbon, both in powder form, are mixed well and added to A. A is heated while dry air is supplied from B.
(d) Carbon powder is added to A. A is heated while dry air is supplied from B.
(1) In which of the experiment(s) in (a) to (d) will the lime water become turbid ?
(2) What substance makes the solution turbid ? Write the chemical formula.
(3) In which of the experiment(s) will the substance added to A be oxidized ?
(4) In which of the experiment(s) will the mass of the material added to A be increased after the experiment ?
Top of Page
(2) The number of protons in a nucleus is always the same as the atomic number.
(3) The ionization energy of the lithium atom is larger than that of neon.
(4) The electronegativity of oxygen is larger than that of carbon.
(5) The M-shell can accept a maximum of eight electrons.
(2) H2O has two lone pairs of electrons.
(3) One of the four N-H bonds in NH4+ is ionic.
(4) The three O-H bonds in H3O+ are equivalent and can not be distinguished.
(5) H2O molecules in ice are bound to each other by hydrogen bonds.
Top of Page
(B) Iron disulfide (FeS2), when heated red in air, undergoes the reaction,
(C) The gas generated reacts with sulfur dioxide according to the following reaction and yields a yellow substance.
(D) It has now become clear that ( )g of the yellow substance forms when sulfur dioxide, formed from 2.05g of FeS2, reacts with the gas evolved by dissolving FeS in hydrochloric acid stoichiometrically.
(b) Compound A is refluxed with hydrochloric acid (6 mol/l) for a few hours. The solution is transferrred to a separating funnel and shaken thoroughly with ethyl ether. The ethyl ether solution (M) is separated from aqueous solution (N).
(c) A crystalline aromatic compound B is obtained when diethyl ether is distilled away from the solution (M).
(d) Compound C separates when an aqueous solution of an inorganic compound X is added to the aqueous solution (N).
(e) Compound C is an aromatic compound and has four hydrogen atoms attached directly to the aromatic ring. Two isomers can be formed when one of the four hydrogen atoms is substituted with chlorine.
(f) Compound B is transformed to a crystalline compound D when refluxed in an aqueous solution of KMnO4.
(g) Compound D, when heated to 230°C, releases water and is changed into a crystalline compound E.
(h) Compound E easily sublimes and yields needle crystals and have a melting point of 131°C to 132°C. Its composition is C 64.87%, H 2.71%. It contains no nitrogen.
Questions:
(1) "Japan's Modern Educational System--A History of the first hundred Years"
(2) "Outline of Education in Japan 1991"
(3) "Japan Almanac 1993"
(4) "Japanese Colleges and Universities 1987"
D.2 Entrance Examination to Private Lower Secondary School
[Q] The following experiments are made using the conditions shown in Figure D.2.1 to generate oxygen and carbon dioxide. Answer the questions below.
(1) What are the pieces of equipment A and B ?
a. Manganese dioxide
(3) In Figure D.2.2, bottles C and E are filled with oxygen and bottles D and F are filled with carbon dioxide. Which would you expect to burn more vigorously than in air when a burning candle is put in C or D, and when burning steel wool is put into E or F ? In which bottle will the fire extinguish ?
(4) After the fires extinguish lime water is poured into all the bottles and shaken. Which bottle(s) will show a visible change ? What change do you expect ?
D.3 Entrance Examination to Private Upper Secondary School
[Q] Electric current flowing through a solution of dilute aqueous sulfuric acid and the aqueous solution of barium hydroxide is measured (Fig. D.3). Answer the questions below.
(1) How much barium hydroxide Ba(OH)2 is contained in 50 g of the barium hydroxide solution when the concentration is 0.2% ?
Ba2+, OH-, H+, SO42-
D.4 Entrance Examination to National Upper Secondary School
[Q] The following four experiments are conducted using the conditions shown in Figure D.4.
(a) Copper powder is added to A. A is heated while oxygen is supplied from B.
Answer the quetions below.
D.5 Center Examinations for University Candidates
Q1. Select the right pair.
a. A pair of ions whose electronic configurations are identical to that of neon.
(1) Ca2+ and K+ (2) Li+ and F- (3) Mg2+ and S2-
(4) Na+ and Cl- (5) Na+ and O2-
b. A pair of transition elements.
(1) Al and Si (2) Ca and Hg (3) Cu and Li
(4) Fe and Ni (5) Mg and Mn
c. A pair of molecular crystals.
(1) Al2O3 and ZnO (2) BaO and CuO (3) CO2 and SiO2
(4) MgO and SO2 (5) CaO and P4O10
Q2. Choose the sentence which is not correct.
(1) The mass of an atom is roughly equal to the sum of the neutrons and protons in the nucleus.
Q3. Choose the sentence which is not correct.
(1) NH3 has a lone pair of electrons.
D.6 Entrance Examinations to Private University
[Q] Read the following sentences and fill the blanks. Also, complete the reactions (1) and (2).
(A) Black precipitate is formed when a gas, which evolves on dissolving iron sulfide (FeS) in hydrochloric acid, is bubbled through an aqueous solution of copper (II). When 1.50g of FeS is completely dissolved in hydrochloric acid, ( ) ml of the gas is obtained at 20°C and 1 atm.
4FeS2 + ( ) ------> ( ) + 8SO2 (1)
According to the reaction (1) 2.05 g of pure FeS2 is converted into sulfur dioxide, which is then absorbed completely by the aqueous solution of hydrogen peroxide. One needs ( ) ml of 1.00 mol/l aqueous solution of NaOH in order to neutralize the resulting acidic solution.
( ) + SO2 ------> ( ) + ( ) (yellow substance) (2)
D.7 Entrance Examination to National University
[Q] Solve problems I and II. If necessary, use the following atomic weights. H: 1.0 C: 12.0 N: 14.0 O: 16.0
Top of Page
1. What is the chemical formula for compound A ?
2. What compound is suitable as X in the experiment (d) ?
3. In what state does compound C exist in the aqueous solution (N) before X is added ? Give the structural formula.
4. Give the structural formula for A, B, D and E.
Top of D
E. FURTHER READINGS
There are not so many books on chemical education in Japan written in English. Though the following were not specifically written for chemical education, they contain a lot of important and useful information on education in Japan in general.
Research and Statistics Division, Minister's Secretariat, Ministry of Education, Science and Culture, 1980
Ministry of Education, Science and Culture, 1991
Asahi Shinbunsha, 1993
The Association of International Education, ed., Maruzen, 1987.
Top of Page